Optimizing MiniMax-H3 Inference with LightX2V
We have developed a series of optimizations for MiniMax-H3 in LightX2V. On a fixed 15-second, 768×1344 workload for text-conditioned audio and video generation, generation-side request latency on a single RTX 5090 fell from 1544.9 s to 72.4 s, a cumulative speedup of 21.35×. Scaling to 8 RTX 5090 GPUs reduced latency further to 12.52 s, a 5.78× speedup over the optimized single-GPU configuration.
Background and Challenges
An H3 request first uses Qwen3-VL to encode the text prompt into conditioning information. A diffusion transformer (DiT) then performs iterative generation, followed by video and audio variational autoencoders (VAEs) that decode the outputs. The main data flow is shown below:
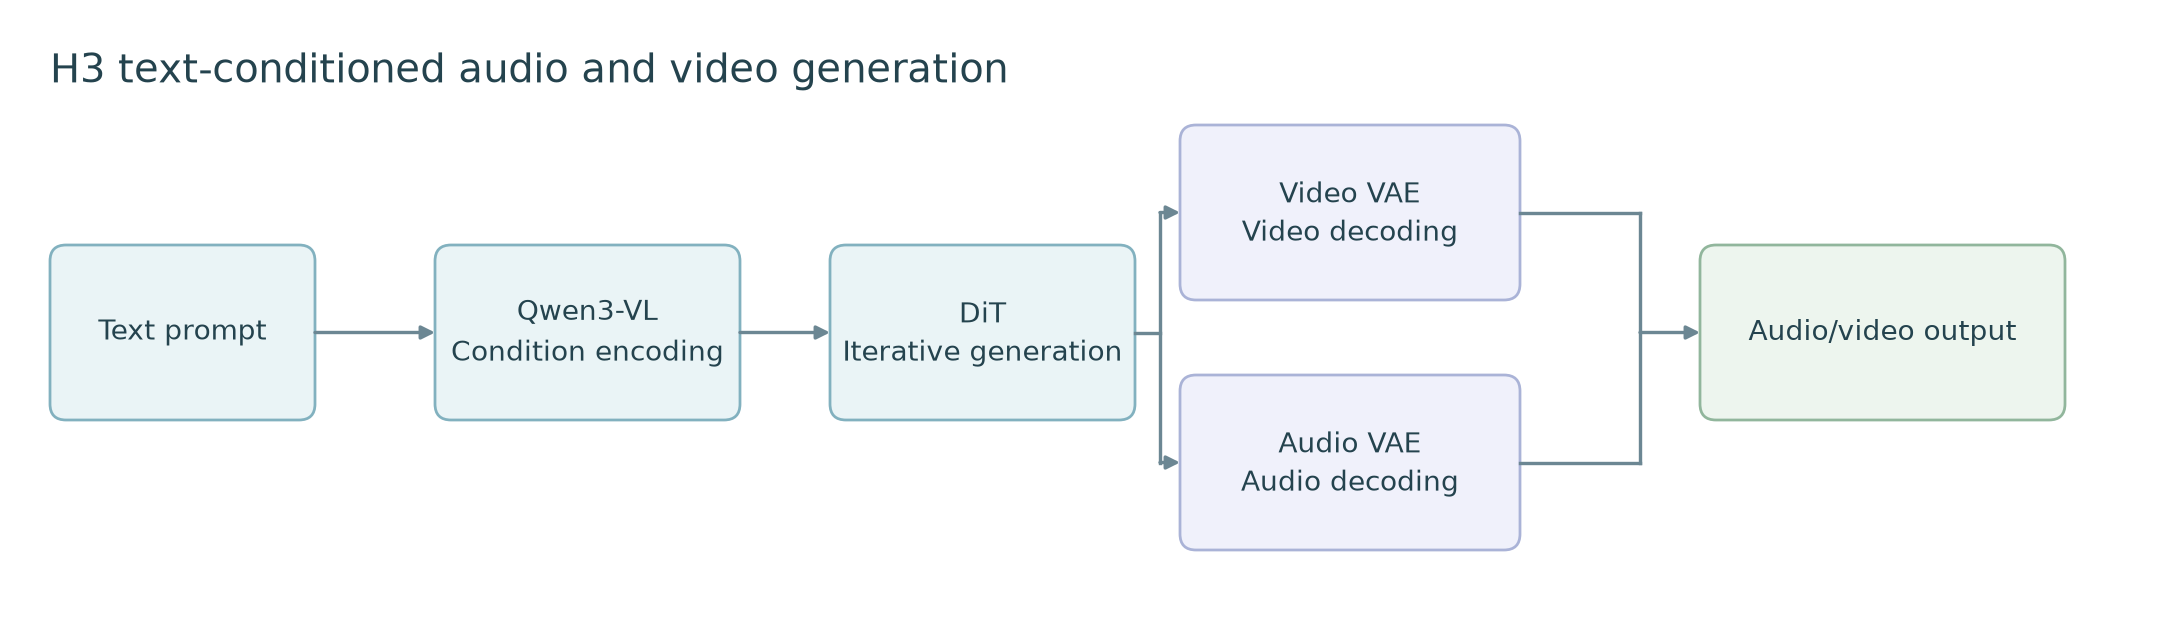
Inference costs span condition encoding, iterative generation, audio and video decoding, and final frame preparation and data transfer. Reducing request latency requires shifting the optimization focus as bottlenecks move, while coordinating algorithms, kernels, GPU memory management, and parallel execution.
Optimization Overview
H3’s optimizations cover six layers: algorithms, quantization, kernels and compilation, transfers and caching, the pipeline, and parallelism.
| Layer | Main Techniques | Problem Addressed |
|---|---|---|
| Algorithms and workload | Turbo DMD, SLA, Sol-Attn, offline merging of fixed LoRA weights | Reduce iterations, attention computation, or repeated low-rank projections |
| Quantization | DiT FP8, Qwen3-VL LLM FP8, Video VAE FP8 | Reduce compute cost, weight storage, and weight transfer volume |
| Kernels and compilation | FP8-SGL, FP8-F16, Sage2, packed QKV, kernel fusion, torch.compile | Improve core kernel efficiency and reduce auxiliary operations and scheduling overhead |
| Transfers and caching | Block offload and prefetching, VAE residency | Reduce repeated model transfers under GPU memory constraints |
| Pipeline | VAE tile selection, GPU uint8 frame preparation and device-to-host transfer (D2H) | Reduce redundant decoding and output transfer volume |
| Parallelism | DiT TP/SP, Qwen3-VL TP, VAE spatiotemporal tile parallelism | Distribute computation, weights, and decoding tasks across GPUs |
Key Techniques and Their Benefits
Turbo DMD Few-Step Distillation
Turbo DMD uses a matching LoRA and a few-step generation recipe to reduce DiT executions from 29 to 4. This also reduces repeated linear operations, attention computation, and associated transfers.
With DMD and its matching LoRA, DiT latency fell from 1497.071 s to 247.058 s, a reduction of 83.50%. Reducing the number of iterations delivered the largest improvement of any single stage in the cumulative chain and established a new starting point for optimizing each iteration.
SLA Sparse Attention
On top of the four-step recipe, SLA selects important attention blocks based on content and uses a specially trained LoRA to compensate for sparsification. The target sparsity ratio is set to 0.85, substantially reducing the attention regions that require computation.
With SLA and its matching LoRA, DiT latency fell further from 247.058 s to 166.831 s, a reduction of 32.47%. This result combines sparse execution with a LoRA recipe change. The target sparsity ratio does not directly translate into the latency reduction of the entire DiT.
Basic FP8 Quantization
The basic quantization stage enables FP8-SGL for DiT, the LLM component of Qwen3-VL, and Video VAE together. FP8 reduces weight storage and transfer volume while enabling higher-throughput low-precision computation for eligible matrix multiplications. Boundary and numerically sensitive layers retain higher precision.
Video VAE also automatically packs its QKV projections when loading quantized weights, allowing Q, K, and V to share input reads and quantization. This optimization is introduced alongside basic FP8, so this stage measures the combined effect of the FP8 execution recipe and its supporting implementation.
| Target Module | Before Quantization (s) | After Basic FP8 (s) | Latency Reduction |
|---|---|---|---|
| DiT | 166.831 | 97.281 | 41.69% |
| Video VAE | 42.985 | 28.965 | 32.62% |
| Qwen3-VL text encoding | 1.385 | 0.967 | 30.16% |
FP8-F16 Linear Execution
Building on basic FP8, we use matrix multiplication with FP8 inputs and FP16 accumulation on SM120, with corresponding adjustments to quantization ranges and weights. The current implementation accumulates across the full K dimension in FP16 and uses in-process tuning on actual model shapes to select the execution implementation.
This stage switches DiT and Video VAE from FP8-SGL to FP8-F16, while Qwen3-VL continues to use FP8-SGL. DiT latency fell from 97.281 s to 80.584 s, a reduction of 17.16%; Video VAE latency fell from 28.965 s to 24.456 s, a reduction of 15.57%.
Auxiliary Kernel Fusion and torch.compile
As core computation becomes faster, auxiliary operations such as normalization, casts, activations, residual connections, and layout conversions account for a larger share of execution time. We compile stable DiT and VAE blocks with torch.compile to fuse eligible operations, and switch DiT’s RMS normalization implementation to sgl-kernel.
Together, these changes reduced DiT latency from 80.584 s to 58.842 s, a reduction of 26.98%, and Video VAE latency from 24.456 s to 22.827 s, a reduction of 6.66%.
VAE Residency
After FP8 quantization reduces Video VAE’s weight storage requirements, we keep the video and audio VAEs resident on the GPU across requests. This reduces model loading before each decode and unloading afterward, lowering transfer and GPU memory management overhead in the decoding stages.
For the fixed 15-second, 768×1344 workload on a single RTX 5090, the VAE module results with residency are:
| Module | Before (s) | After (s) | Latency Reduction |
|---|---|---|---|
| Video VAE decode | 22.827 | 17.608 | 22.86% |
| Audio VAE decode | 0.703 | 0.101 | 85.70% |
Video VAE Tile Selection
VAE decoding uses spatiotemporal tiles to control GPU memory requirements. Adjacent tiles need overlapping regions, so excessive tiling introduces redundant computation. Tile shapes also affect the execution shapes of matrix multiplication and attention.
For 768×1344 inputs, we change the spatial tile shape from 256×256 to 304×320. Applying the production partitioning logic, the number of tile tasks for the full video falls from 588 to 315, a reduction of 46.43%; the total spatial area decoded falls by approximately 20.48%. Single-GPU Video VAE latency fell from 17.608 s to 10.650 s, a reduction of 39.52%.
DiT SP, Qwen3-VL TP, and Video VAE Tile Parallelism
When scaling the final recipe to multiple GPUs, we enable parallel execution in three modules together:
- DiT uses sequence parallelism (SP). Long sequences are distributed across GPUs, with Ulysses handling the exchanges required by attention. Communication optimizations include fused rearrangement, head parallelism, and FP8 communication.
- The Qwen3-VL LLM uses tensor parallelism (TP). Each rank loads and computes with its own weight shard. For short text inputs, reducing the amount of weights loaded through block offload is also valuable.
- Video VAE uses spatiotemporal tile parallelism. Tile tasks are distributed across ranks, then the outputs are gathered and stitched together.
Comparing the final recipe on 1 RTX 5090 GPU and on 8 RTX 5090 GPUs, DiT latency fell from 60.614 s to 9.431 s, a 6.43× speedup; Video VAE latency fell from 10.650 s to 1.659 s, a 6.42× speedup; and Qwen3-VL condition encoding fell from 0.956 s to 0.106 s, an 8.98× speedup.
Cumulative Request-Level Performance: Single-GPU Optimization and Multi-GPU Scaling
Establishing a Runnable Single-GPU Baseline
To run inference on a single RTX 5090 with 32 GB of GPU memory, we enable block offload for DiT and the Qwen3-VL LLM. Weights remain on the CPU and are transferred to the GPU layer by layer. Prefetching with two buffers aims to overlap the transfer of the next layer with computation on the current layer. The video and audio VAEs are loaded onto and unloaded from the GPU at their respective stages; Video VAE uses spatiotemporal tiling to control peak decoding memory. The baseline also retains Sage2 attention and GPU frame preparation: cropping, layout adjustment, and uint8 conversion are performed on the GPU before frames are transferred to the CPU. These settings form the common starting point for subsequent optimizations.
Measurement Conditions and Timing Boundaries
The main workload is fixed to text-conditioned audio and video generation at 768×1344, 362 frames, 24 fps, and 15 seconds. We use the same prompt and seed on RTX 5090 GPUs with approximately 32 GB of GPU memory, running on 1, 2, 4, and 8 GPUs. The host has dual Xeon Gold 6530 processors, with the GPUs distributed across two NUMA domains.
Generation-side request latency includes condition encoding, DiT, audio and video decoding, frame conversion, GPU-to-CPU transfer, and request cleanup. It excludes MP4 encoding and saving, as well as network transmission. This measures the cost of generation in steady state, rather than cold-start or first-frame latency.
Progressively Optimizing a Single RTX 5090
The single-GPU tests start from high-precision eager execution and the baseline settings described above, then progressively add FP8, compilation, model residency, and other optimizations. Each stage uses a cumulative configuration; the latency reduction in the table represents the combined benefit introduced at that stage.
| Stage | Optimization Added | Generation-Side Latency (s) | Reduction vs. Previous Stage | Speedup vs. Baseline |
|---|---|---|---|---|
| 0 | Runnable high-precision eager baseline | 1544.928 | — | 1.00× |
| 1 | DMD few-step generation recipe | 295.884 | 80.85% | 5.22× |
| 2 | SLA sparsity and matching LoRA | 213.537 | 27.83% | 7.23× |
| 3 | Basic FP8 and VAE packed QKV | 130.018 | 39.11% | 11.88× |
| 4 | DiT and Video VAE FP8-F16 | 107.977 | 16.95% | 14.31× |
| 5 | Auxiliary kernels and torch.compile | 85.674 | 20.66% | 18.03× |
| 6 | Combined transfer and caching optimizations | 80.389 | 6.17% | 19.22× |
| 7 | VAE tile selection | 72.366 | 9.98% | 21.35× |
This chain also shows how bottlenecks shift. The first two stages reduce DiT’s workload; low-precision execution and compilation then improve efficiency, followed by reductions in model transfers and redundant VAE decoding. Final single-GPU request latency is 72.366 s, a 21.35× speedup over the starting point.
Scaling the Final Recipe Across RTX 5090 GPUs
We retain the four-step SLA recipe, FP8-F16 for DiT and Video VAE, compilation, the final transfer configuration, and 304×320 tiles while increasing the GPU count. DiT uses SP2, SP4, and SP8 on 2, 4, and 8 GPUs, respectively. Qwen3-VL enables TP2, TP4, and TP8, and Video VAE uses tile parallelism across the corresponding number of GPUs.
| RTX 5090 GPUs | DiT / Qwen3-VL / Video VAE Parallelism | Generation-Side Latency (s) | Speedup vs. Final Single-GPU Configuration |
|---|---|---|---|
| 1 | Single GPU | 72.366 | 1.00× |
| 2 | SP2 / TP2 / tile parallelism across 2 GPUs | 40.938 | 1.77× |
| 4 | SP4 / TP4 / tile parallelism across 4 GPUs | 21.657 | 3.34× |
| 8 | SP8 / TP8 / tile parallelism across 8 GPUs | 12.518 | 5.78× |
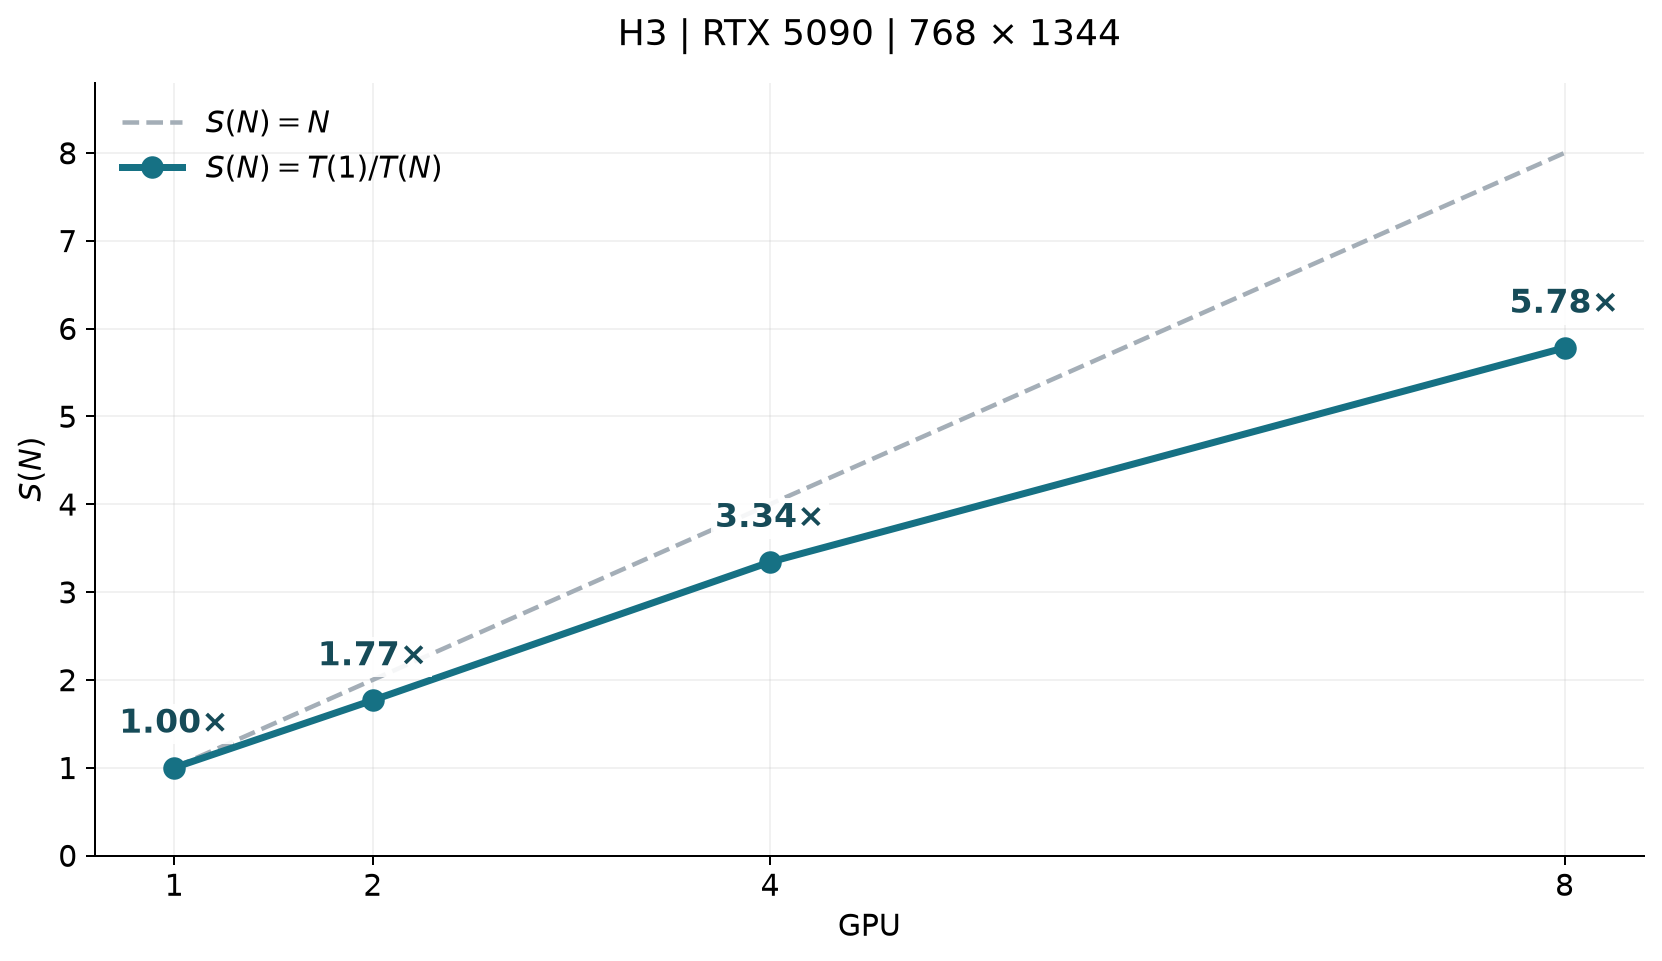
The solid line shows S(N)=T(1)/T(N), using the optimized single-GPU latency of 72.366 s as the baseline. The dashed line shows ideal linear scaling, S(N)=N. All points use the same final recipe. With 8 GPUs, request speedup reaches 5.78×, corresponding to approximately 72.26% parallel efficiency.
Declining Request Latency from Single-GPU Optimization to Multi-GPU Scaling
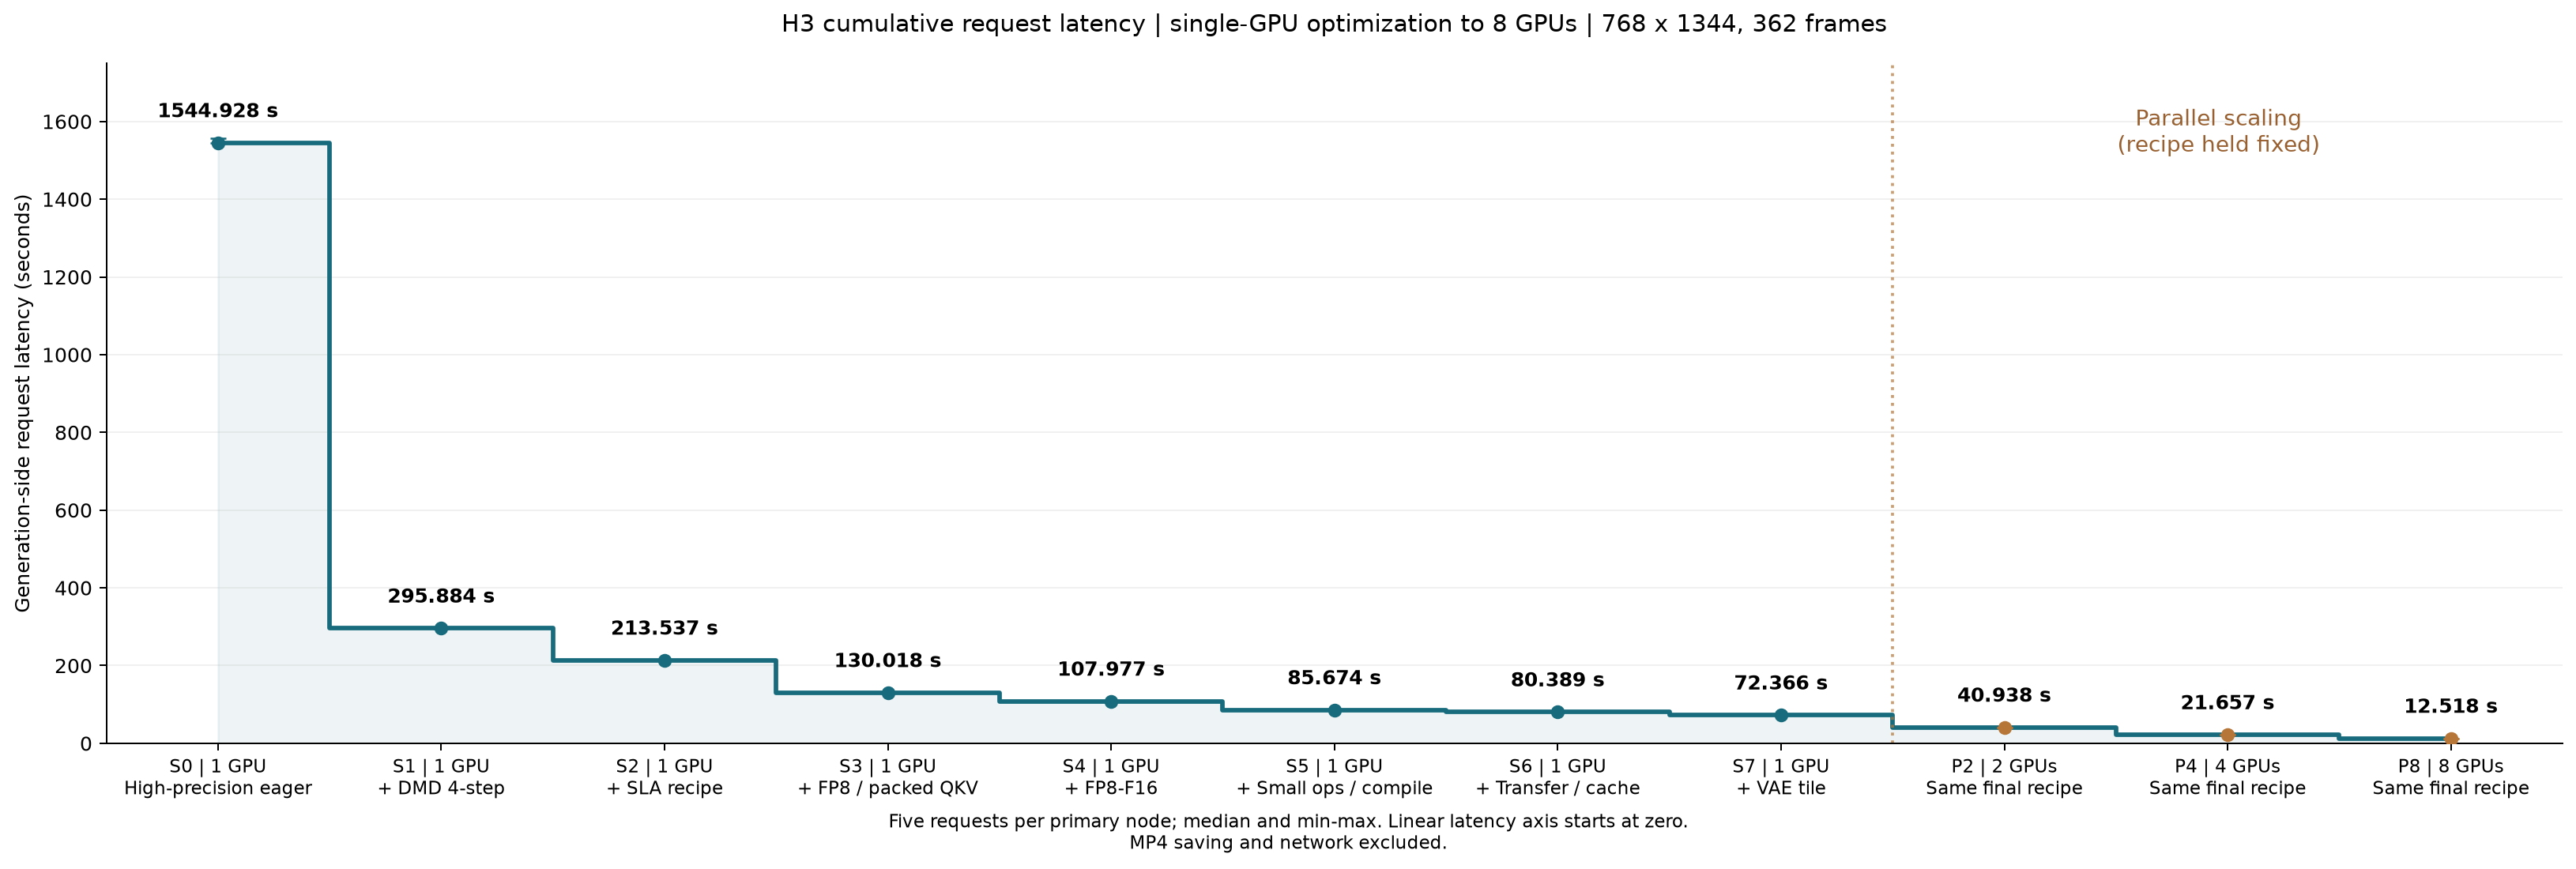
The first 8 nodes show cumulative technical optimizations on a single RTX 5090. The next 3 nodes scale the final recipe to 2, 4, and 8 RTX 5090 GPUs. The vertical axis shows absolute latency starting at zero, and the labels give the median generation-side request latency at each node. The single-GPU table, parallel scaling table, and this chart all use the same set of nodes.
The complete chain reduces latency from 1544.928 s to 12.518 s, a 123.41× speedup. Single-GPU technical optimizations contribute 21.35×, and scaling the final recipe from 1 to 8 GPUs contributes 5.78×. The overall speedup includes algorithmic recipe changes, engineering optimizations, and an increase in GPU count.
RTX 5090 Deployment Results Across Video Specifications
After the cumulative ablation tests on the main workload, we also compare deployment performance for different video specifications:
| RTX 5090 GPUs | Resolution | Video Duration | Generation-Side Latency (s) | RTF |
|---|---|---|---|---|
| 2 | 544×960 | 5s | 7.452 | 1.442 |
| 4 | 544×960 | 5s | 3.985 | 0.771 |
| 8 | 768×1344 | 15s | 12.518 | 0.830 |
The real-time factor (RTF) is generation-side latency divided by the actual video duration. A value below 1 means that generation is faster than playback in these tests. Here, 544p means 544×960 at 124 frames and 24 fps, with an actual duration of approximately 5.167 s. The 768p setting is 768×1344 at 362 frames and 24 fps, with an actual duration of approximately 15.083 s.
In these tests, 4 RTX 5090 GPUs generating 544p video and 8 RTX 5090 GPUs generating 768p video both achieve real-time performance on the generation side. 2 RTX 5090 GPUs generating 544p video have not yet reached that threshold.
Summary and Next Steps
H3 optimization follows a shifting focus: first reduce computation through few-step and sparse recipes, then improve the efficiency of core kernels and auxiliary operations, reduce repeated transfers, and finally let the modules make effective use of multiple GPUs.
For the fixed 15-second, 768×1344 workload, this approach reduces generation-side latency to 72.4 s on a single GPU and to 12.52 s on 8 RTX 5090 GPUs. The best configuration and its benefits depend on input size, hardware, and interactions between modules. Continuously identifying the bottleneck guides the choice of the next optimization.
Next, we plan to systematize the bottleneck analysis, candidate selection, experimental validation, and accumulated experience from this work into a self-optimizing, self-evolving inference system. The system would analyze new models and execution conditions, propose and validate optimizations, and learn effective strategies from the results.